
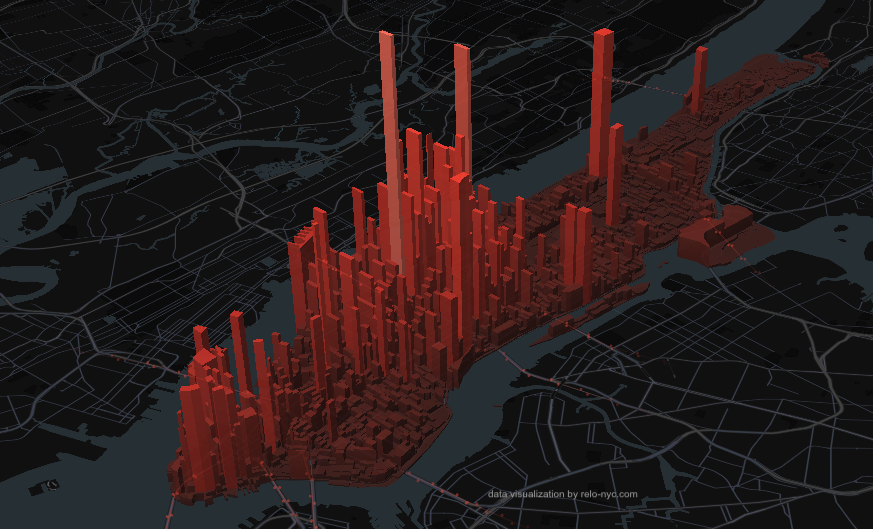
Manhattan Pulse is an interactive data visualization built by RELO NYC that models how Manhattan’s population shifts hour by hour, block by block, across a typical workweek. A resident base of 1.66M swells to a daytime peak of 3.97M as commuters arrive for work, then empties out again by evening — a surge of nearly 2.5x every single weekday.
Why we built this
We understand that for people relocating to the city it’s hard to get a feel for different areas until you’re actually on-the-ground, but we wanted to share a way for people to enhance their understanding by visualizing the volume and density of Manhattan’s population during the course of a week. The aim for this resource is to help inform real decisions: which neighborhood to headquarter an office in, how a commute may feel at 8AM versus 6PM, and where to look when searching for an apartment.
How it works
Each bar on the map represents a 2020 Census block. Overnight, people are distributed according to residential population. As the day progresses, the model shifts that distribution toward job locations using 2022 LEHD workplace data, with the hourly rhythm of the shift driven by MTA subway ridership from the week of May 4–10, 2026. Subway traffic serves as a proxy for all travel modes, and arrivals are modeled via commute symmetry. The whole model is calibrated against New York University Wagner’s widely-cited ~4 million daytime population estimate.
Click any bar to select its neighborhood and see how it moves through the day on its own.
Take a look
Whether you’re planning a team relocation or just curious about the pulse of the island, we hope you enjoy it and learn something new about New York.
Want more analysis like this? Subscribe for free and we’ll send you more deep dives into NYC’s neighborhoods, workforce trends, and what they mean for companies moving talent here.